InTransit Headline Animator

PhoenixMoney Headline Animator

Teaars in Raadiated Raain Headline Animator

Slideshow

amzn best deals

Total Pageviews

flag counter / rev map

free counters
Free counters

dt rs

Watch live streaming video from daytraderrockstar at livestream.com

Wednesday, November 2, 2011


Home » Chart Of The DayMarket IndicatorsMost Recent Stories

94% OF THE S&P IS TRADING ABOVE ITS 50 DAY MOVING AVERAGE

31 OCTOBER 2011 BY CULLEN ROCHE 18 COMMENTS

It’s moments like this when technical indicators can provide very valuable insights.  Glancing at a quick chart or a statistical data set can be enormously enlightening.  The current short-term technicals could be a reason for some concern here as we are reaching unprecedented levels according to some indicators.   When markets make extreme movements we often enter brief periods of statistical anomaly.
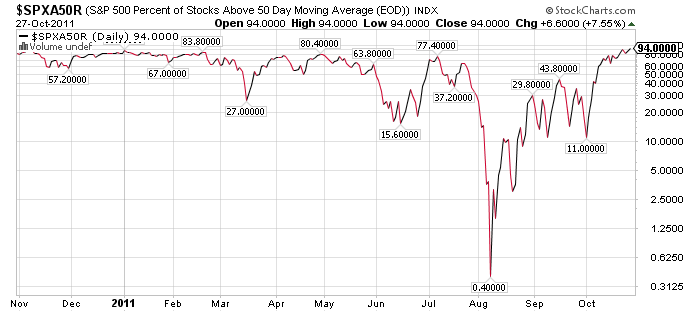
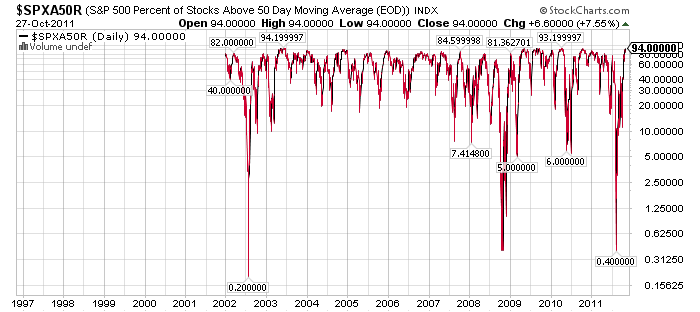
The current cause for some concern is the market’s extraordinary overbought conditions based on some metrics.  The most eye opening of which is the % of S&P 500 stocks above their 50 day moving average.  The current reading of 94% has been registered just once in the last 10 years.  I’ve provided both long-term and short-term charts below:
On Friday Bespoke Investments noted the even more extreme situation in financials.  100% of the S&P 500 financial sector is now trading above its 50 day moving average:
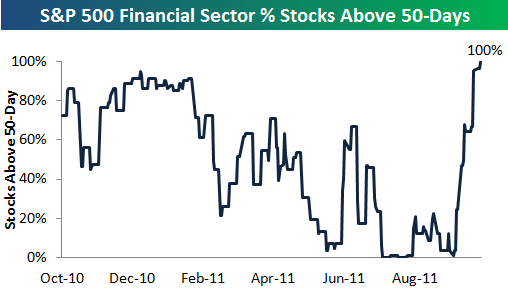
If you’re a believer in mean reversion you have to start wondering if the recent rally hasn’t been overdone.  Granted, this is just one indicator out of the hundreds that investors should follow, but rare data points such as the above are always worth noting….
Source: StockCharts.com

\
COMMENTS GUIDELINE - Readers who denigrate authors or other readers will be banned without warning. This site does not tolerate any sort of reader abuse. The goal of this site is to create an environment that is conducive to learning and better understanding of the monetary system and the investment world. We expect readers to behave maturely and responsibly. We welcome and encourage intense and intelligent discourse, but the site adheres to a strict 1 strike policy. While it is your right to speak freely, it is not your right to behave childishly. Above all else, please enjoy the site. It is intended to be used as an educational tool and we hope the intelligent and mature debate will further that purpose. We hope readers will make an effort to respect that goal. Comments with excessive linking or foul language will be moderated before posting.
Comments
  • Leverage
    With almost a correlation of 1 (or -1) between different assets classes and almost every single value out there I don’t find it so strange. What this means, however, and if this situation can persist much longer, I don’t know.
  • Octavio Richetta
    Also posted at Mauldin’s letter post below. This is what changing the rules does to you:http://www.businessinsider.com/italian-german-bond-spread-french-banks-2011-10
  • JZW
    Better without the log scale
  • Dan Jiddish
    I wouldn’t use any sort of historical analysis with this figure. This is just a numerical output of the choppy and correlated trading over the last 3 months.
  • Wayne
    Last time 94% was reached looks to be Q1 2003, uh, wasn’t that the start of bull mkt that last till 07? I follow this exact chart and the peaks in values of over the 50dma don’t correlate at all to peaks in the stock mkt.
  • Calvin
    Italian 10-year yields added 15 basis points to 6.18 percent today, something Cullen said to keep an eye on for that “magical” 7 percent.
  • godot10
    High frequency trading co-located supercomputers dominate trading and the markets now. Why would one not expect greater extremes and higher correlations as a logical consequence?
    If one wants to trade against the machines, one has to hold fewer positions with greater conviction, in things you really believe are fundamentally sound, and trade minimally. Fewer bets, and only when the odds are stacked in your favour long term, and ignore the HFT-induced volatility.
    “Strange game. The only way to win is not to play (very much).” to paraphrase a popular eighties movie. I don’t like the odds of trying to beating the HFT supercomputers on a short term time scale. Volatility is a just supercomputer bullying.
    • Roger Ingalls
      Godot10:
      Good reminder.
      Was that quote from War Games, Matthew Broderick? Ah yes, it is, here’s another
      Stephen Falken: The whole point was to find a way to practice nuclear war without destroying ourselves. To get the computers to learn from mistakes we couldn’t afford to make. Except, I never could get Joshua to learn the most important lesson.
      David Lightman: What’s that?
      Stephen Falken: Futility. That there’s a time when you should just give up.
  • Larry
    godot10, I agree with you about fewer trades, and holding a few positions for a longer time with conviction. Due to the ongoing very slow growth of the BSR, I think the ETF’s to buy and hold here over the next 6 to 12 months are: LQD, VCLT, XLU all yielding 4% or more. Maybe throw in a bit of EMB yielding 6.5% I’m also holding Gundlach’s fund DLTNX. Do any of you good folks care to share any conviction “holds” for this period which Felix Zulauf said in Barron’s is a very difficult time to invest?
  • VII VII
    Cullen- I am slowly putting each piece of the Roche Algo puzzle together…Slowly my friend.
  • Wantingtoretire
    Time to get the shorts set-up. Log scales always quash everything at the top end.
  • Wantingtoretire
    Time to hold precious metals….please
  • FundofFuns
    Cullen- From a momentum/ trend trading perspective, isn’t this a positive sign? I agree that from a contrarian perspective this would be one of many good indicators establishing a reversion to the mean, but what about the flip side of the coin?
    • Good point. Extreme breadth readings like these are almost always either initiation moves or exhaustion moves, and tend to lead to a binary outcome.
      The two previous highest readings shown above were spring 2003 (initiation) and spring 2010 (exhaustion). Use this knowledge to smartly define your risk/reward and you have a tremendous trading opportunity.
  • HousOfCards
    Great info, Cullen… but does anyone else notice how much more common it has been in the past few years for all stocks to be above or below their 50-dma. That unified movements can almost only be explained by the expansion of ETFs in the marketplace. Right?
    If that’s true, then 10 years from now the only way to add significant Alpha is going to be in private equity or small cap stocks.
  • hoser
    Yeah the market is over bought! With my Tax Dollars! PPT. Look, the FED is wearing no clothes….

No comments:

Post a Comment